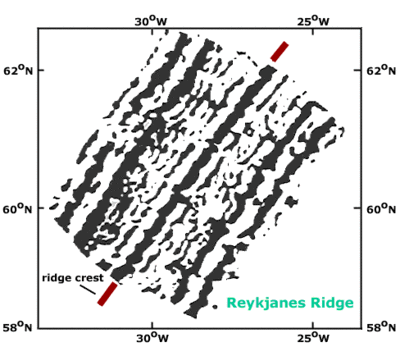
Map of magnetic anomalies in the ocean just south of Iceland. Positive anomalies, where the magnetic field is stronger than average, are marked black while negative anomalies, where the field is weaker, are white. The axis of the mid-Atlantic ridge, here known as the Reykjanes Ridge, is marked in red. Note that the striped pattern is roughly symmetrical about the ridge.
The clinching piece of evidence came from an unlikely place. As well as measuring the shape and depth of the ocean floor, scientists had also measured the magnetic field as they criss-crossed the oceans.[1]
They knew what the overall average strength of the magnetic field should be, but they wanted to measure the small local deviations too.[2] These fine-grained variations are known as magnetic "anomalies".
When they mapped these anomalies they found a striking pattern: zebra stripes. The positive anomalies, where the field was a little bit stronger than the average (marked black on the picture), and the negative anomalies, where it is weaker (white on the picture), formed distinct bands along the ocean floor. These stripes were between a few kilometres and tens of kilometres wide.
When they compared this pattern with the shape of the ocean floor they saw that the stripes lined up parallel with the mid ocean ridges. And what was even more intriguing, the patterns of stripes were symmetrical on either side.
The magnetic field was measured using a magnetometer dragged behind a boat. This was first done systematically in the late 1950s.
It was already known that the magnetic field varies smoothly from the poles where it is strongest to the equator where it is weakest; it is the small deviations from this average magnetic field that are of interest.
The anomalies in the magnetic field are less than 10% of the total average magnetic field.

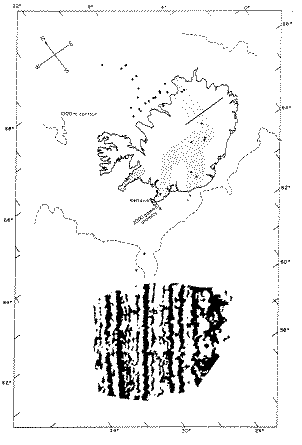
Map of magnetic striping with Iceland, to show scale and location.
Picture is from:
J.R.Hietzler et al, "Magnetic anomalies over the Reykhanes Ridge", Deep Sea Research, 13 (1966), p 427-443. summary paper
Author: Tom Brown
Copyright: public domain
Date last modified: 7th Oct 2011
Peer-review status: Not yet peer-reviewed
ridgeAnomalies.gif: http://www.gg.uwyo.edu/content/lecture/plates/divergent_margins/magneticstripes.asp?color=873F8A&Callnumber=23165, copyright: unkown, adapted from Hiertzler et al., 1966.
Reykjans.gif: http://www.phy6.org/earthmag/mill_6.htm from Heirtzler 1968.